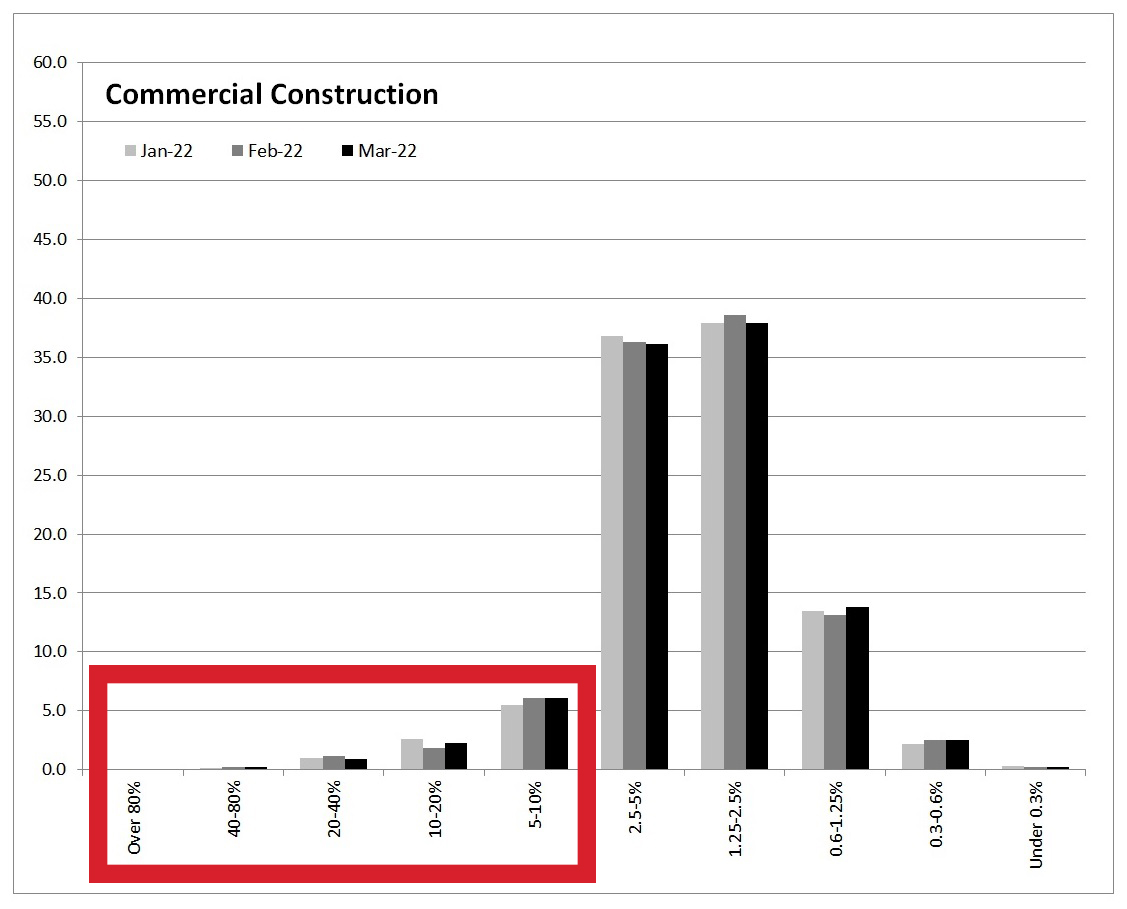
Of the four business sectors we monitor, Commercial Construction continues to pose the greatest risk of liquidation.
Our regular data series, which we provide to the New Zealand Hardware Journal, assesses the level of credit risk posed by the four business sectors most closely associated with the Construction & Hardware industry:
- Residential Construction
- Commercial Construction
- Hardware, Building & Garden Supplies Retailing
- Core Retailing
Below is the New Zealand Hardware Journal’s commentary:
Looking at the wider picture this month, it is interesting to see improvement in most but not all of these risk profiles from the same time last year.
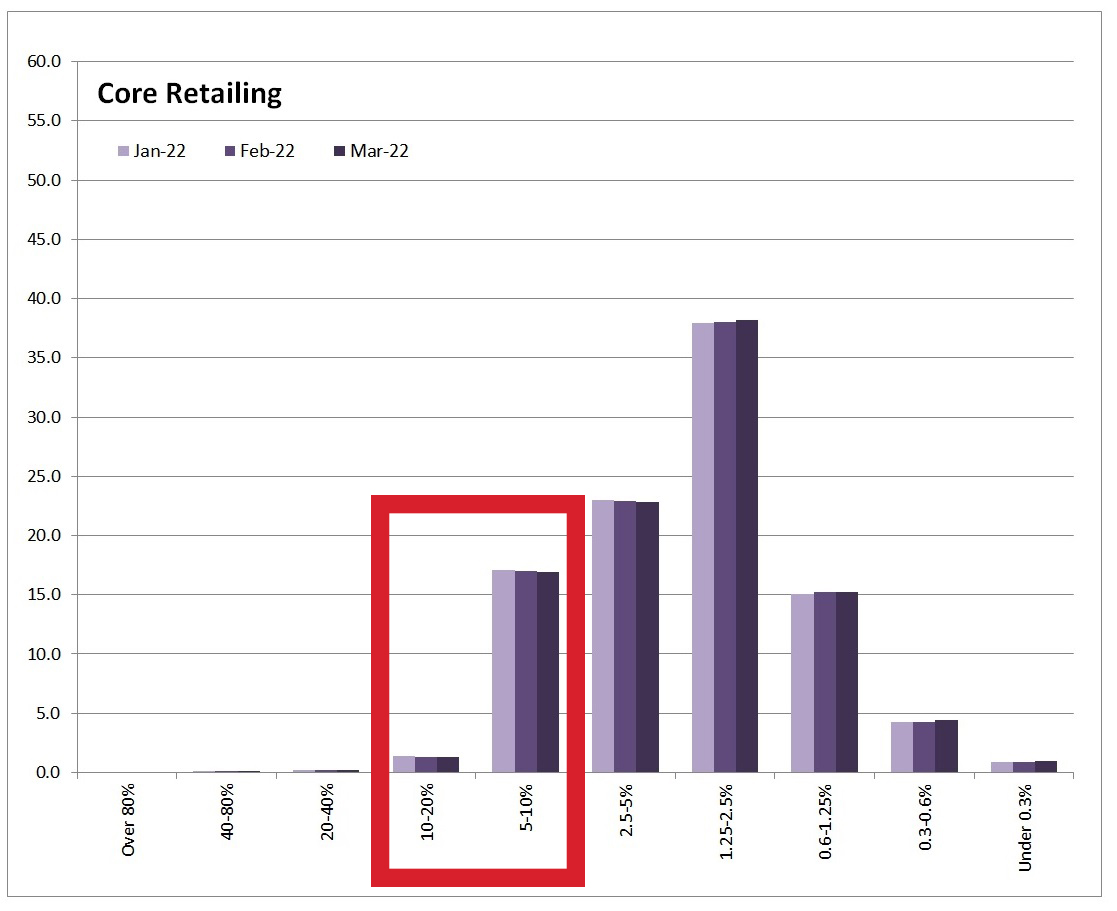
From the perspective of accounts with a greater than 5% likelihood of failure in the next 18 months, Core Retailing currently carries the greatest risk with 18.5% of all debt exposure for the sector falling into this category (see chart below for more detail).

“Given the nature of the retail debt market, it is not surprising,” qualifies CreditWorks’ Alan Johnston. “Nevertheless, this risk band has almost halved in the last 12 months, down from 37.7% this time last year.”
The Hardware & Garden Retailing sector has also improved, from 3.6% to 3.4% of all exposure in this category, with Residential Construction too having halved its risk from 6.2% to 3.1% and continuing to show the lowest percentage representing a failure risk of over 5% (see the charts below for more detail).


However, Commercial Construction continues to be a concern as the only sector whose position has deteriorated over the last 12 months, now registering a 9.5% result in March, against 9.3% this time last year (see chart below for more detail).

In this respect, Alan Johnston says: “While in percentage terms, it may seem that the Core Retailing sector is at greater risk, it must be remembered that retail accounts are generally of much greater number, with risk generally spread over thousands of accounts, and usually small in exposure per account.
“In comparison, the Commercial Construction sector is made up of a far smaller number of players, with each carrying debt of much higher levels.
“So, to have 9.5% of the Commercial Construction sector representing a risk of greater than 5% failure would represent a much greater loss per company, should they ‘fall over’, so to speak.”
The charts are a visual explanation of the last three months’ risk profiles across our four chosen sectors.
The left axis indicates the % of a sector that is at risk. The bottom axis shows the % likelihood of failure over the next 18 months.

