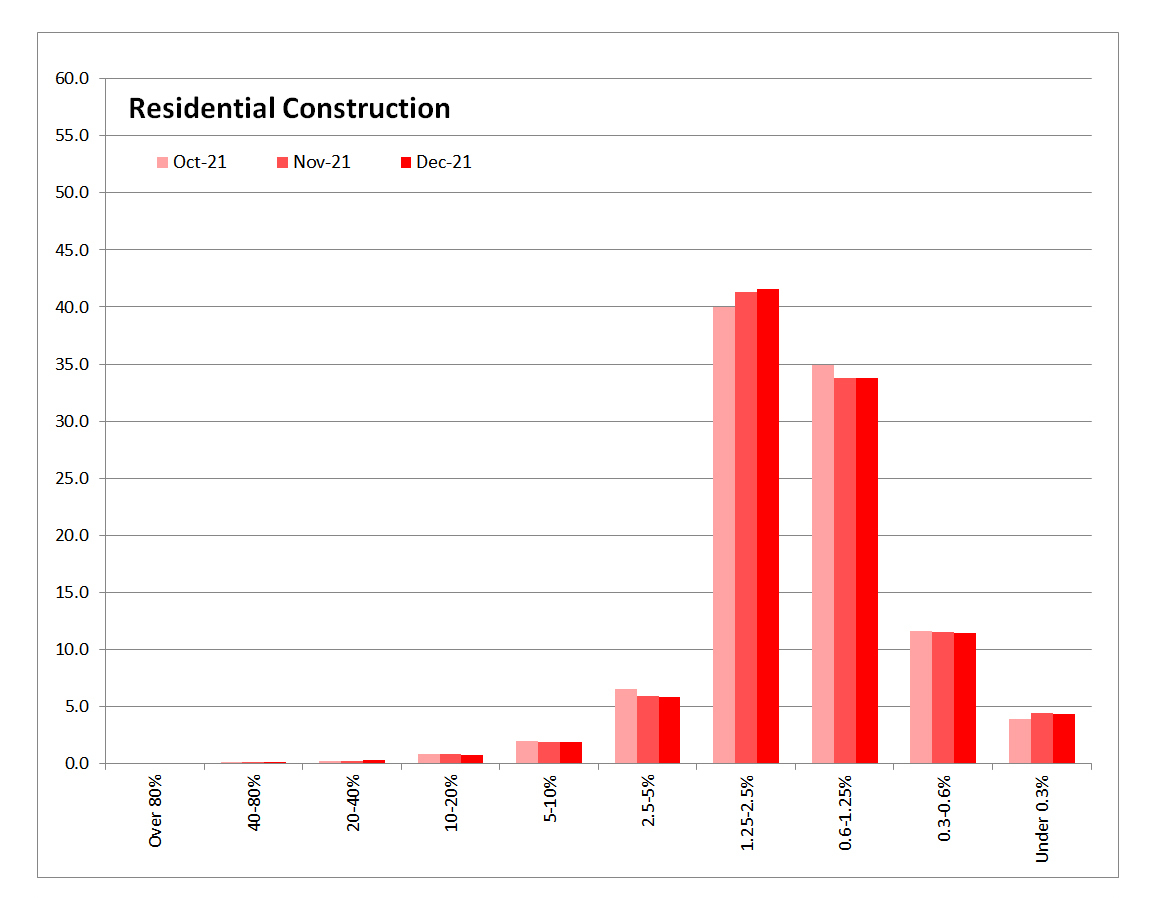

Our regular data series, which we provide to the New Zealand Hardware Journal [www.hardwarejournal.co.nz], assesses the level of credit risk posed by the four business sectors most closely associated with the Construction & Hardware industry:
- Residential Construction
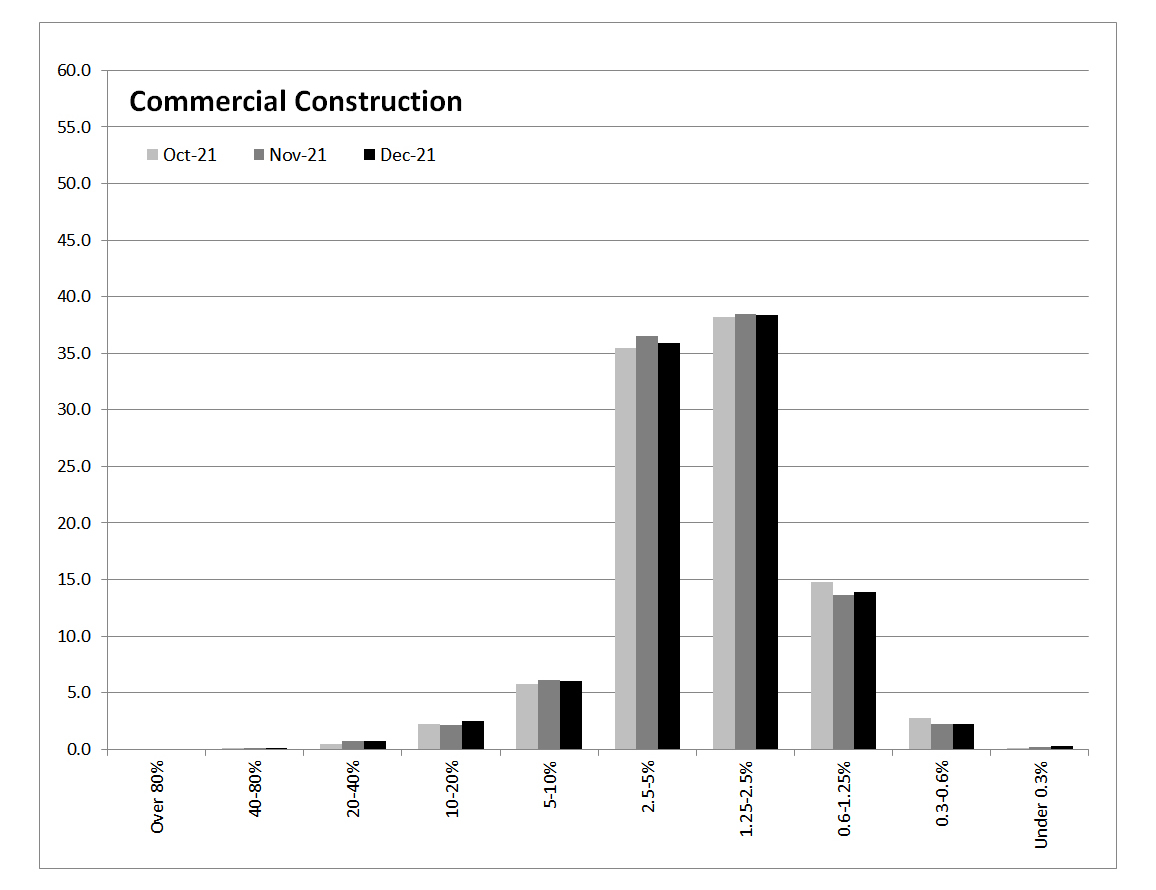
- Commercial Construction
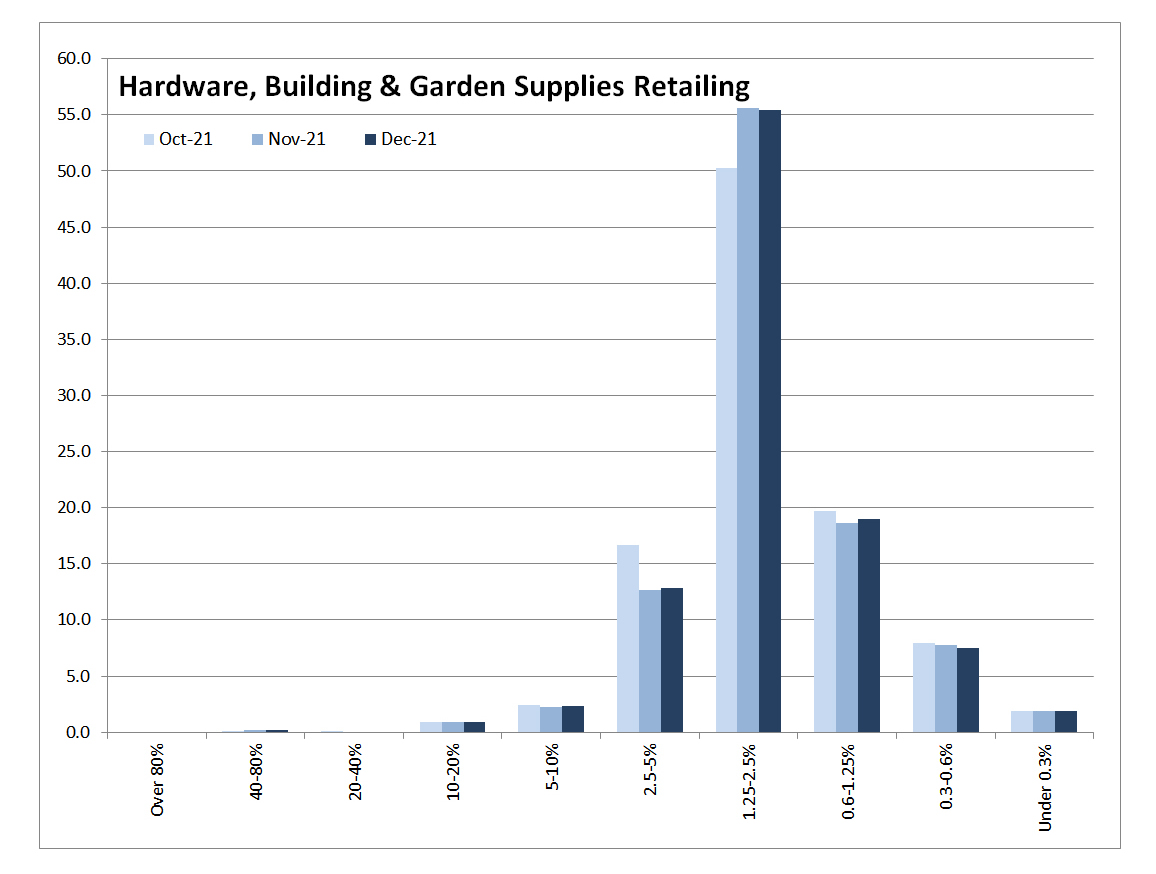
- Hardware, Building & Garden Supplies Retailing
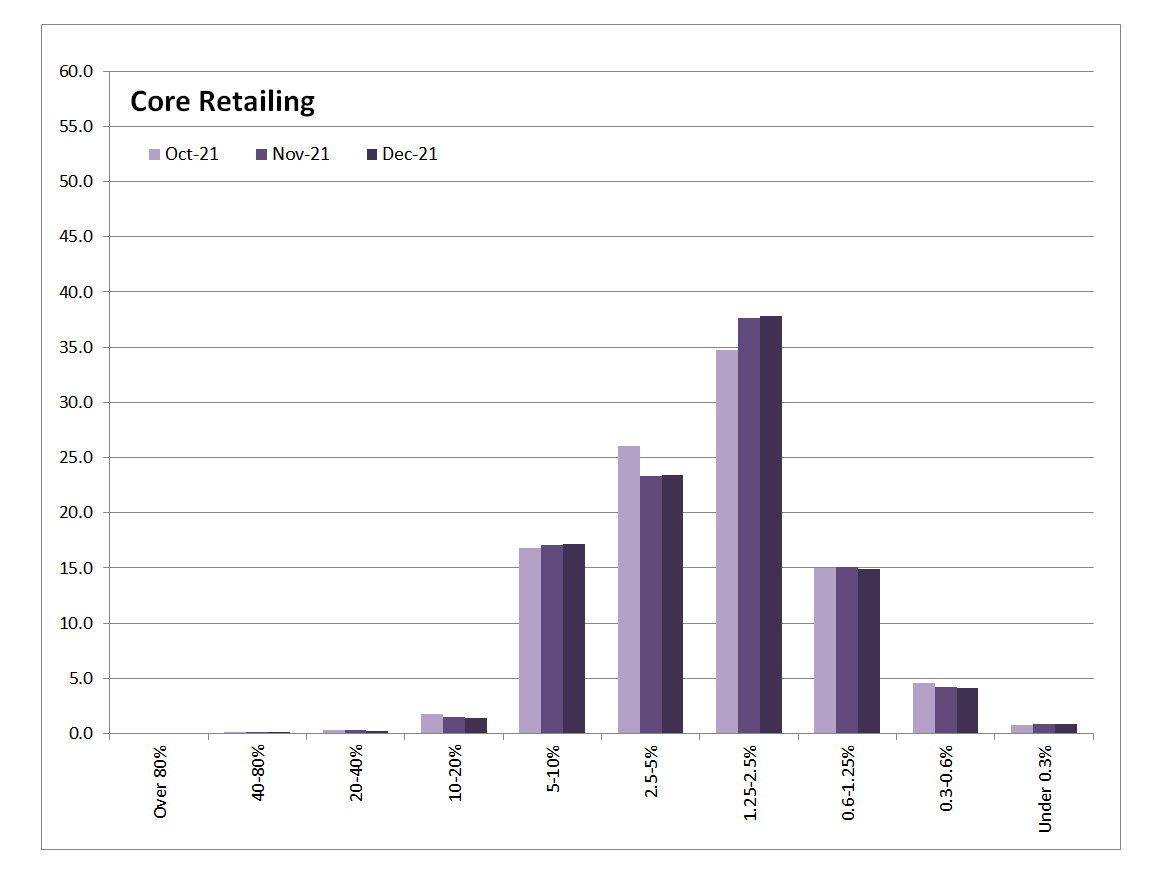
- Core Retailing
Below is the New Zealand Hardware Journal’s commentary:
Our last update, reporting on the October month (posted 25 November), raised the likelihood of further stress in building sector cash flows.
And, with the ongoing and well-documented supply, pricing and staffing issues facing all businesses at present – particularly those in the building sector – it is therefore interesting to see what effect, if any, these issues are having on the merchants and retailers from a debt perspective.
Armed now with November and December 2021 data, CreditWorks’ Alan Johnston is happy to pass on that CreditWorks has been receiving “only good reports” regarding debt payment in the sectors we monitor, and that “Despite the issues referred to above, November was the highest sales month for the building trade in history!
“That said,” continues Alan, “it is evident that with the uncertainty surrounding future supply lines, many building companies are taking the opportunity to order in advance, and stockpile product where possible, due to anticipated demand.”
Across the Core Retailing and Hardware, Building & Garden Supplies Retailing sectors there has been little movement in debt risk over the last three months.
If anything, risk has reduced slightly.
However, in the Residential and Commercial Construction sectors that we monitor (see the first two charts below), we are seeing slight increases in risk in the higher risk bands (20-80%).
In this respect, adds Alan Johnston: “Those who have been feeling the debt pressure over recent months will find it tough going forward, since the January to March period is known as the most difficult period with respect to collecting debt.”
Now see the charts below for a visual explanation of the last three months’ risk profiles across our four chosen sectors.
The left axis indicates the % of a sector that is at risk. The bottom axis shows the % likelihood of failure over the next 18 months.